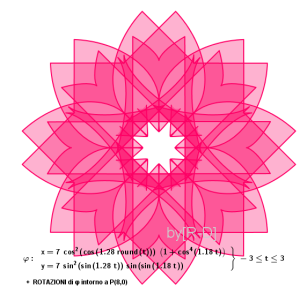
In my last couple of months I have been fascinated by parametric curves. They are incredibly beautiful. So, I decided to show you some of my favorite ones and also a small introduction about them.
Firstly, a parametric equation of a curve express the coordinates of the points of the curve as functions of a variable, called a parametric.Most known are x = sin t and y = cos t , which are parametric equations for the unit circle, where t is the parameter. Together, these equations are called a parametric representation of the curve.
The examples that everyone knows when it come to graphs (parabola, circle, ellipse, parabola and so on) all can be represented as parametric equations. The ones that I find more interesting are the ones that have this representation: x = f(sin t, cos t) and y = g(sin t, cos t) ( the coordinates x and y are functions of sin t and cos t). The unit circle is the basic one, but the ellipse can also be written like this:
An ellipse in general position can be expressed as
as the parameter t varies from 0 to 2π. Here
is the center of the ellipse, and
is the angle between the
-axis and the major axis of the ellipse.
And now comes the funny part… The more complicated ones. So here are some my favorite examples:
You can see that all my examples use just functions in sin and cos. Also, the colors used make them more nicely (but creativity is ‘at home’ everywhere). You can check my Facebook album if you want to see more and also my Pinterest album . Right now I am more into the 2D shapes, but for sure 3D ones will become of interest very soon.
If you are interested in these things you can trying drawing some of your ones here (this website gives you a good feeling how you can construct them). As always the Wikipedia page is useful (and I have used it as reference for my examples and definitions). Moreover Khan Academy has a couple of interesting videos about parametric equations, their use in other fields (physics) and also about representing some of them.
I haven’t tried writing this type of articles before, but let me know if you would like to see more like this one. (I could try and write small articles about different math concepts; this one was fun and constructive to write.) Any feedback is appreciated so use the like and share buttons!
Let me know what you think about this series. Enjoy the day. If you have ideas for future blog posts, let us know. You can find us on Facebook, Tumblr, Google+, Twitter and Instagram. We will try to post there as often as possible.
Lots of love and don’t forget that maths is everywhere! Enjoy!


Very nice! And the page to play drawing curves is just a math-game 😉 …
LikeLiked by 1 person
Hello, These formulae look great but I am having problems understanding how to generate the curves.
So you have a set of parametric equations to generate (x, y) coordinates for points on a plane, is that correct?
Because when I try that I get a random curve that looks nothing like the ones above.
So my question is how do I generate (x, y) values for points so I can plot them on a Cartesian coordinate system using the formulae that you have on each image?
Thanks
LikeLiked by 1 person
Hi, thank you for asking me this. The graphs are made with GeoGebra. First of all the graphs where not made directly by me, but I have an idea of how they are made: the equation are inserted as curve equations. Moreover, some transformations are made to the graphs, such as rotation around a point, or a reflection. Hope this made more sense.
I have made some by myself, but I haven’t tried nothing extremely complicated.
LikeLiked by 1 person
hello
maybe, you must play with “t” in terms of radians, that’s because you are using it in sin and cos functions and, as LThMath says, a little bit of “post production” mirroring and rotating. For example, look the red one base: https://www.wolframalpha.com/input/?i=parametric+plot+(2.5*(sin(-5t))%5E(2)*2%5E(cos(cos(4.28*2.3t)))),+(2.5*sin(sin(-5t))*(cos(4.28*2.3t))%5E(2)),+t%3D-3+to+3
LikeLike
I built my little own function in Javascript that works in a similar way. I create a bunch with some nice results, you can check them out in this Google Photos library https://photos.app.goo.gl/ZNyyCYzkP3zgodYo1.
LikeLike
They look incredible. Would you like to contact us at lthmathematics@gmail.com to discuss more about your work.
LikeLike
Great work. Can you pl. include the parametric equations that you used for each artwork?
LikeLike
How do you manage to rotate the parametric functions to achieve those shapes? I have been using a website called desmos and here’s where I’ve got to: https://www.desmos.com/calculator/qgpsphbn9a
I would greatly appreciate if you could help me out, thanks!
LikeLike
Hi, thank you for asking me this. The graphs are made with GeoGebra and I am not 100% sure how to rotate functions in Desmos. I have little knowledge on Desmos, but I have searched for some articles online. It seems like https://vondesmos.wordpress.com/2016/01/28/rotating-a-function/ has a good explanation. Hope this helps.
LikeLike
I love the power of parametric equations. Some of my work is in
My focus there has been in drawing the lines so that alternate intersections follow the under/over rule. I am very interested in those where the intersections are fairly evenly distributed in the field of the diagram, i.e., not bunching up and not very sparse anywhere.
LikeLiked by 1 person
Inspired by this site, I created some Guilloche patterns at
LikeLiked by 1 person
This looks incredible … WOW!!! 🙂
LikeLike
Wonderful! I am very interested in learning drawing of parametric curves. Thank you for this nice post.
LikeLiked by 1 person
You are welcome 🙂
LikeLiked by 1 person
You are welcome. Regards
LikeLike